Hyperparameter Tuning & Zoo Mixing Analysis
Does training against a zoo of past opponents produce stronger agents? We optimized hyperparameters with Optuna, re-ran the full A-sweep, and found that the answer is no — but we discovered something more interesting along the way.
Motivation
Our earlier study found that zoo training (mixing in past opponents during self-play) improved seeker win rates across 20 game configurations. But that study used default hyperparameters and measured strength only against same-run opponents. Two questions remained:
- Are the default hyperparameters holding back one algorithm? If PPO’s defaults are poorly tuned, zoo training might appear to help simply because it compensates for bad optimization.
- Does zoo training produce agents that are strong against all opponents? A high win rate against your own training partner doesn’t guarantee robustness.
Hyperparameter Optimization with Optuna
We used Optuna to find optimal hyperparameters for both PPO and SAC via distributed Bayesian optimization on a SLURM cluster. Each trial trained self-play agents for 1M steps and maximized a balance score: $\min(\text{SWR}, 1 - \text{SWR})$, which peaks at 0.5 when the seeker and hider are evenly matched.
Search Spaces
PPO (100 trials, 20 parallel workers, ~5 min/trial):
| Parameter | Range | Optimized |
|---|---|---|
| Learning rate | $[3 \times 10^{-5},\; 3 \times 10^{-3}]$ (log) | $6.7 \times 10^{-4}$ |
| Discount $\gamma$ | $[0.95,\; 0.999]$ | $0.957$ |
| GAE $\lambda$ | $[0.9,\; 0.99]$ | $0.902$ |
| Clip ratio | $[0.1,\; 0.3]$ | $0.162$ |
| Train iterations | $[3,\; 20]$ | $20$ |
| Batch size | ${1024, 2048, 4096}$ | $4096$ |
| Entropy coefficient | $[0.001,\; 0.1]$ (log) | $0.014$ |
| Target KL | $[0.005,\; 0.05]$ | $0.022$ |
SAC (100 trials, 20 parallel workers, ~27 min/trial):
| Parameter | Range | Optimized |
|---|---|---|
| Learning rate | $[10^{-4},\; 3 \times 10^{-3}]$ (log) | $2.3 \times 10^{-4}$ |
| Discount $\gamma$ | $[0.9,\; 0.999]$ | $0.969$ |
| Soft update $\tau$ | $[0.001,\; 0.05]$ (log) | $0.0066$ |
| Initial $\alpha$ | $[0.05,\; 1.0]$ (log) | $0.607$ |
| Buffer size | ${25\text{K}, 50\text{K}, 100\text{K}, 250\text{K}, 500\text{K}}$ | $100\text{K}$ |
| Batch size | ${128, 256, 512}$ | $256$ |
| Updates per step | $[1,\; 4]$ | $4$ |
| Warmup steps | ${3\text{K}, 5\text{K}, 10\text{K}}$ | $5\text{K}$ |
Both algorithms converged to lower discount factors ($\gamma \approx 0.96$) than the typical default of 0.99 — shorter-horizon credit assignment helps in this fast-paced game. PPO preferred larger batches and more optimization passes per update.
Best balance scores: PPO 0.484, SAC 0.489 — both near-perfect 50/50 equilibrium.
Technical Note: Bug Fix
During HPO development, we discovered a critical bug in the PPO self-play rollout: the environment was reset at the start of every rollout (32 env steps), making hider timeout episodes (200 steps) impossible to observe. This caused SWR=1.0 in all trials regardless of hyperparameters. The fix was to persist environment state across rollouts — matching the behavior of the zoo trainer.
FR Sweep v2: Optimized Hyperparameters
Using the Optuna-optimized hyperparameters, we re-ran the full sweep:
\[5 \text{ reward presets} \times 2 \text{ algorithms} \times 5\; A \text{ values} \times 3 \text{ seeds} = 150 \text{ runs at 5M steps each}\]Training SWR Results
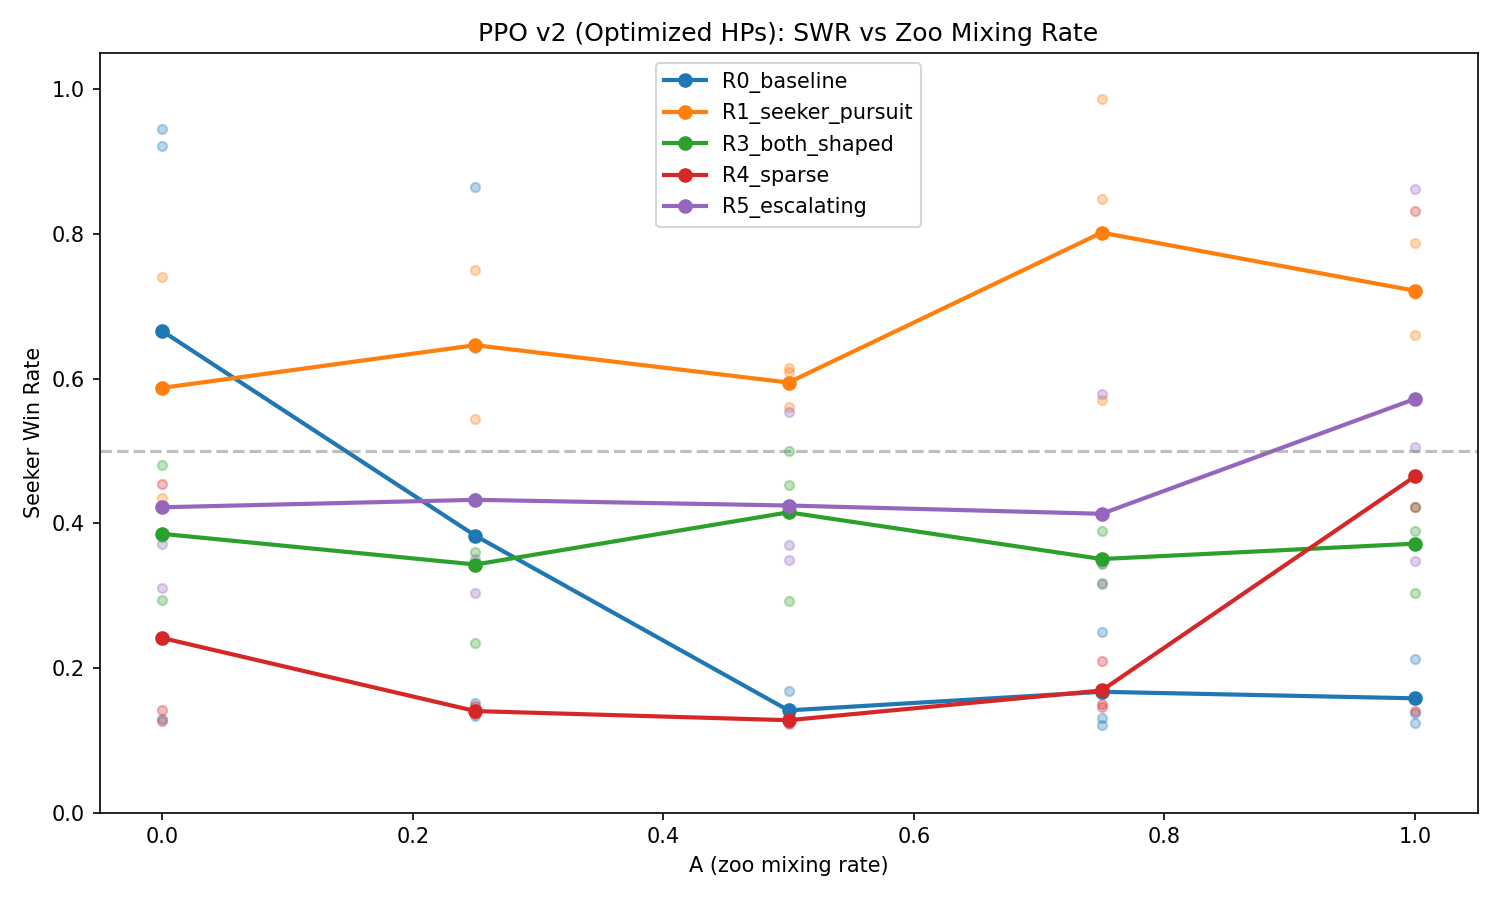 PPO seeker win rate vs. zoo mixing rate A (optimized hyperparameters). Individual seeds shown as faded dots; lines show means across 3 seeds.
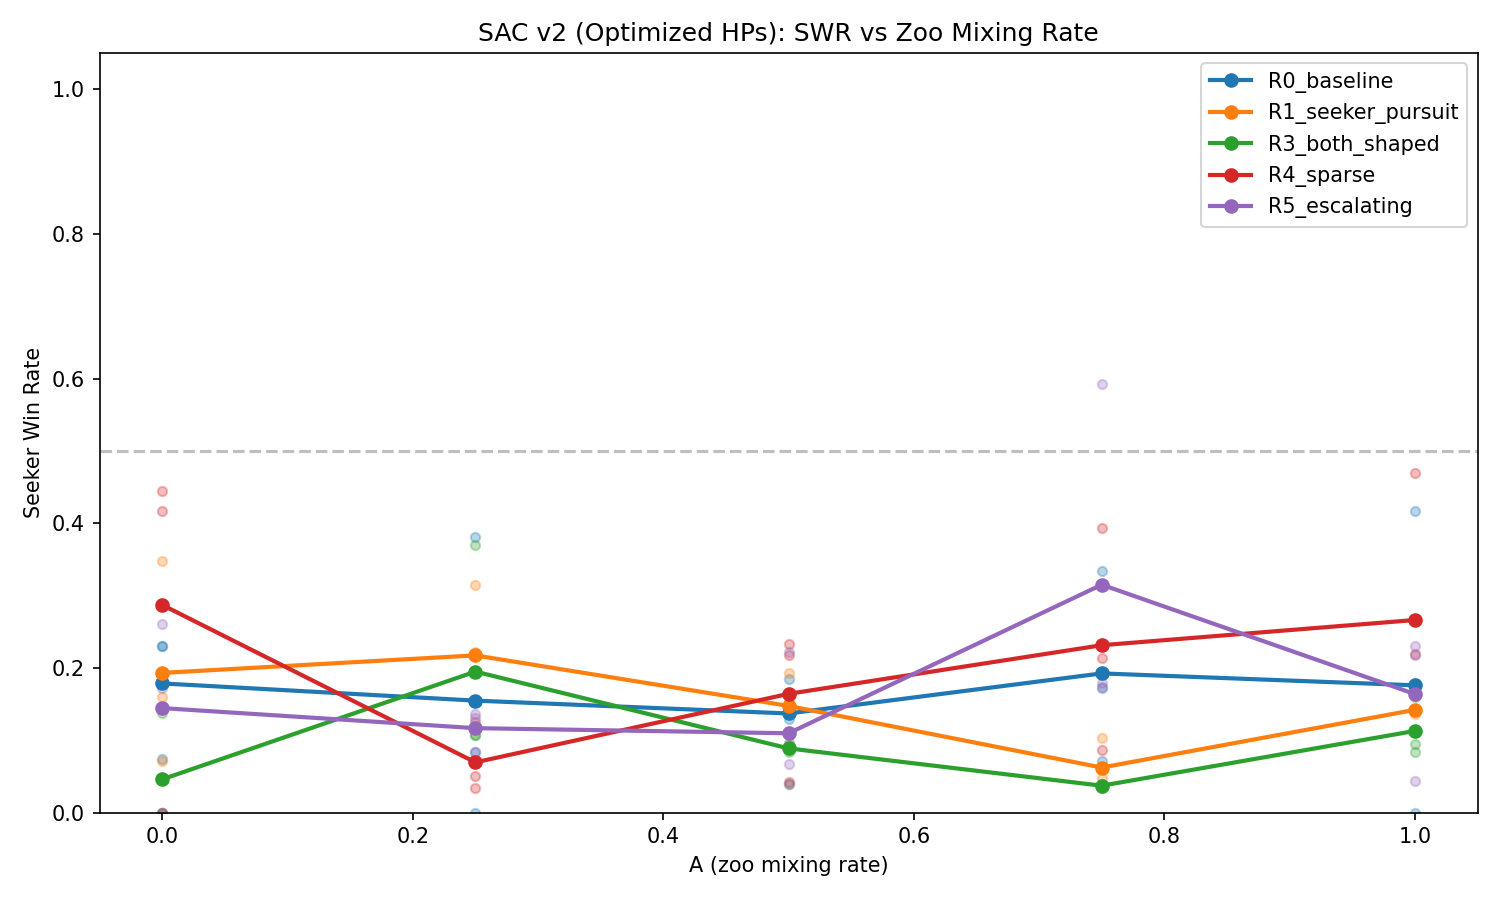 SAC seeker win rate vs. A. SAC remains hider-dominant (~15% SWR) across all configurations — but as the gauntlet reveals, this doesn’t mean the agents are weak.
The optimized hyperparameters improved PPO’s mean balance score from 0.224 to 0.275 (+22%). SAC showed minimal change (+0.009), remaining hider-dominant during training.
Cross-Config Gauntlet: Who’s Actually Strong?
Training SWR tells you about balance within a run — not about absolute strength. To answer “does A produce stronger agents?”, we ran a full cross-evaluation gauntlet:
- 50 configs (best seed per preset/algo/A combination)
- 2,500 matchups (all-vs-all), 50 episodes each
- 125,000 total evaluation episodes
SAC Dominates PPO
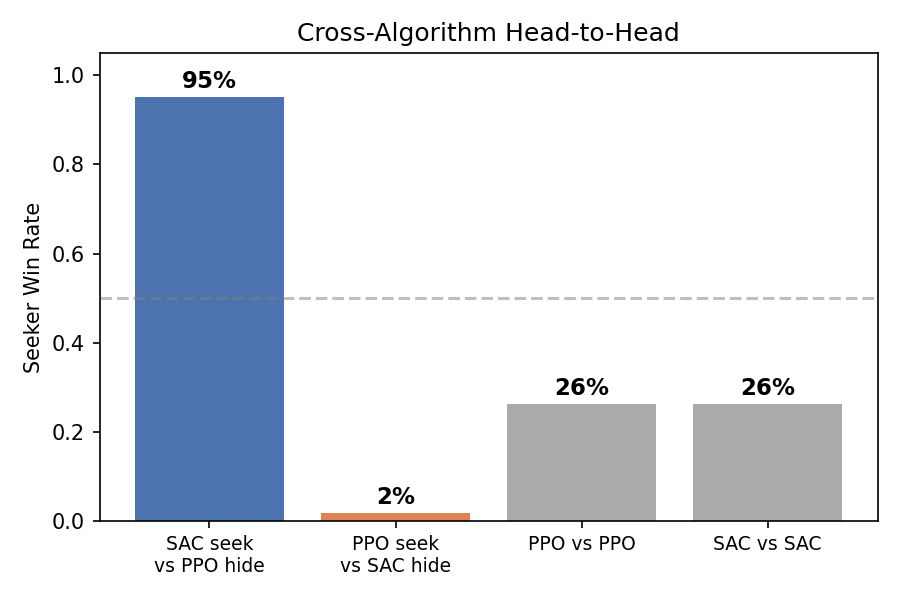
The result is unambiguous:
| Matchup | Seeker Win Rate |
|---|---|
| SAC seeker vs PPO hider | 95% |
| PPO seeker vs SAC hider | 2% |
| PPO vs PPO (within-algo) | 26% |
| SAC vs SAC (within-algo) | 26% |
SAC produces dramatically stronger agents in both roles, despite appearing to “fail” during training (15% SWR, oscillating). Even the best PPO seeker wins only 2.3% against SAC hiders.
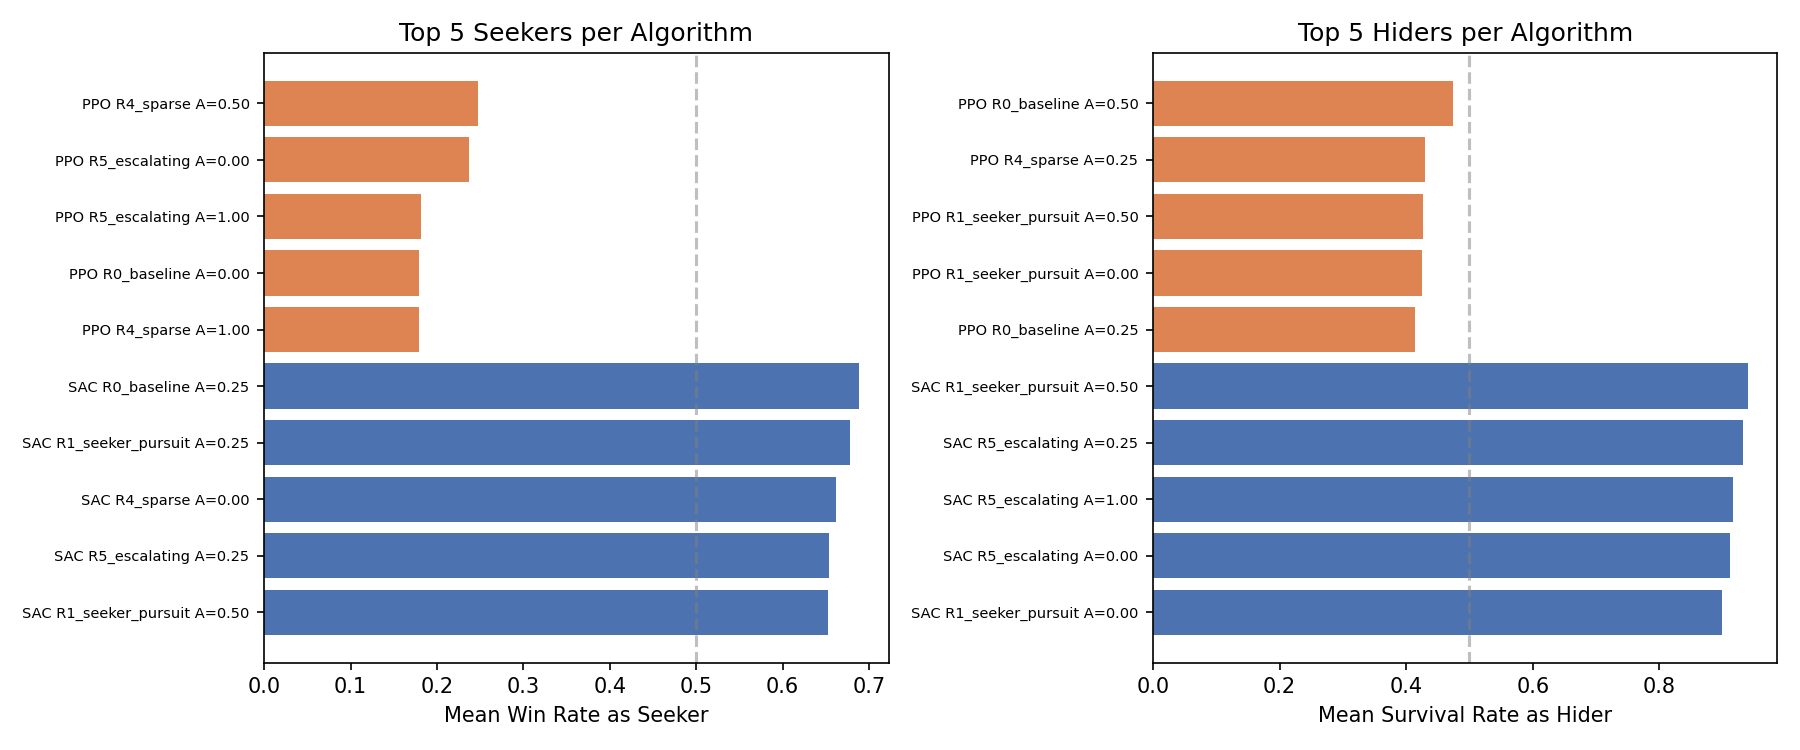 Top 5 seekers and hiders per algorithm, ranked by mean performance across all opponents.
A Value Has No Effect on Strength
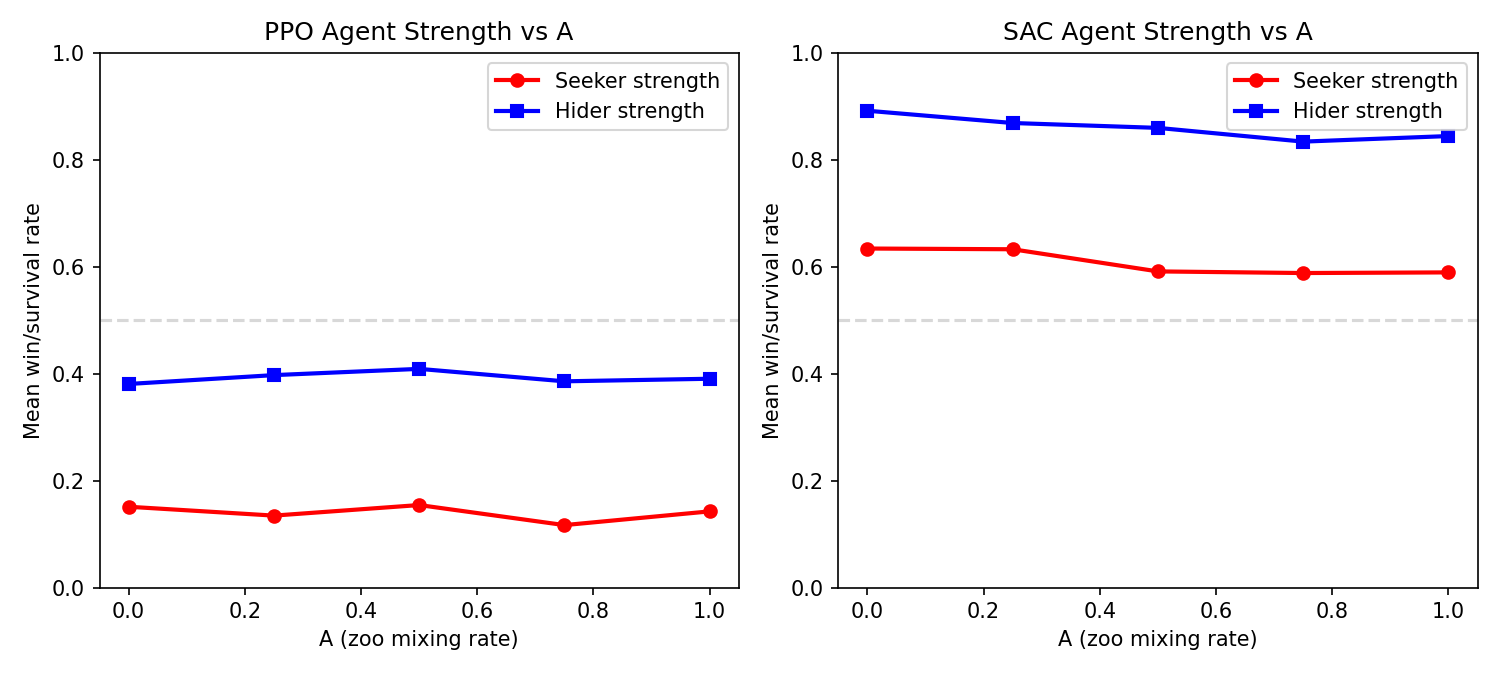 Agent strength vs. zoo mixing rate, measured by gauntlet performance. Flat lines = A doesn’t matter.
Within each algorithm, varying A from 0.0 (pure self-play) to 1.0 (full zoo sampling) produces no meaningful change in agent strength:
PPO within-algo (seeker WR):
| A=0.00 | A=0.25 | A=0.50 | A=0.75 | A=1.00 |
|---|---|---|---|---|
| 28.4% | 25.1% | 29.0% | 21.8% | 26.8% |
SAC within-algo (seeker WR):
| A=0.00 | A=0.25 | A=0.50 | A=0.75 | A=1.00 |
|---|---|---|---|---|
| 28.4% | 30.5% | 22.5% | 24.8% | 24.9% |
No trend. Pure self-play (A=0) produces agents just as strong as full zoo training (A=1).
Forgetting Regret
Despite zoo training’s failure to improve strength, we observed massive forgetting — particularly in SAC:
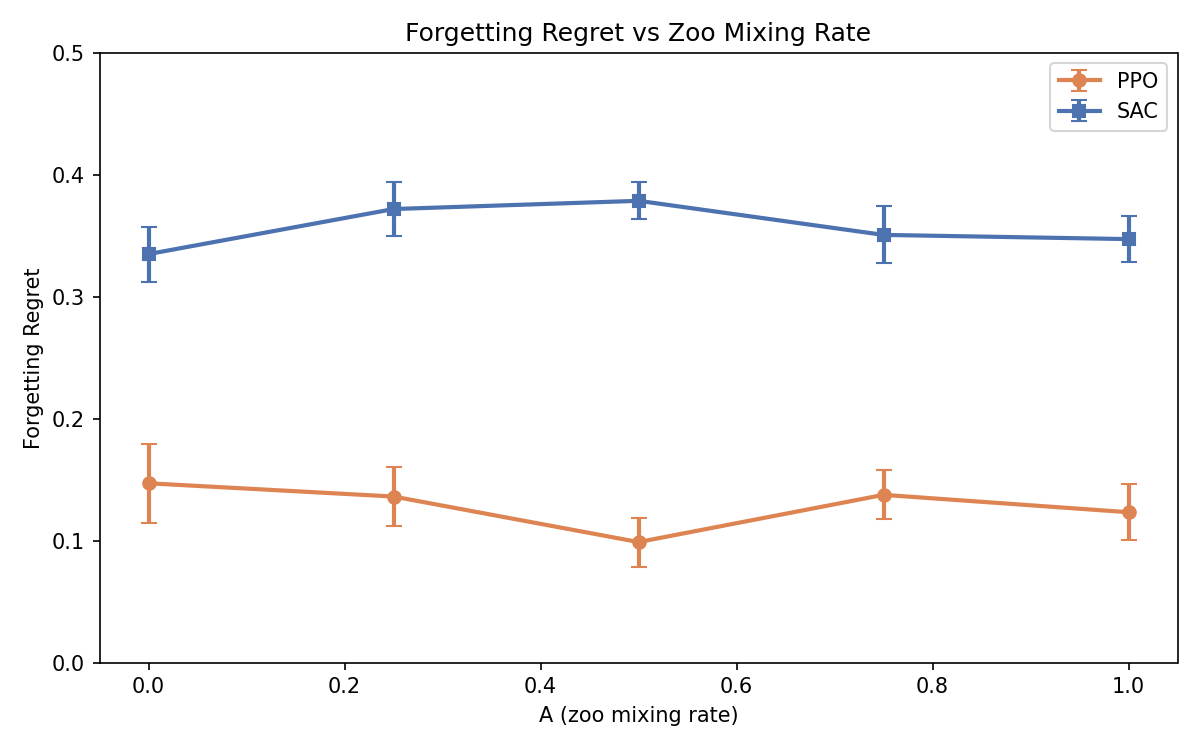 Forgetting Regret vs. zoo mixing rate. FR = peak balance score during training minus final balance score. Higher = more forgetting. Error bars = SE across seeds.
| Algorithm | Mean FR | Runs with FR > 0.1 | Runs with FR > 0.2 |
|---|---|---|---|
| SAC | 0.357 | 75/75 (100%) | 70/75 (93%) |
| PPO | 0.129 | 50/75 (67%) | 12/75 (16%) |
SAC agents reach near-perfect balance (peak ~0.50) within the first 1–2M steps, then collapse to SWR ~0.05 by 5M steps. Every single SAC run exhibits substantial forgetting. PPO shows less forgetting overall, but some runs (particularly R0_baseline) lose up to 0.44 balance.
Does A reduce forgetting? No — FR is flat across all A values for both algorithms.
Conclusions
-
The A-parameter hypothesis is dead. Zoo mixing rate has no measurable effect on agent strength (gauntlet) or forgetting (FR analysis). Pure self-play produces agents just as capable as full zoo training.
-
Algorithm choice is what matters. SAC produces dramatically stronger agents than PPO (95% vs 2% in cross-algo play), despite appearing to fail during training. The self-play oscillation that makes SAC’s training curves look bad may actually be beneficial — cycling through diverse strategies could produce policies with a wider behavioral repertoire.
-
Training SWR is a poor proxy for agent quality. SAC’s 15% training SWR (hider-dominant) hides the fact that both the seeker and hider are learning robust, transferable behaviors. PPO’s balanced-looking 40% SWR masks weaker overall agents.
-
Optimized hyperparameters help modestly. The Optuna-tuned parameters improved PPO’s balance by 22% but didn’t change the fundamental algorithm ranking. Both algorithms preferred lower discount factors ($\gamma \approx 0.96$) than typical defaults.
-
Reward preset matters less than algorithm. R5_escalating and R4_sparse produce slightly stronger agents, but the effect is small compared to the PPO/SAC gap. The reward design lessons from the reward shaping study still apply for producing interesting behaviors, even if they don’t dramatically affect competitive strength.
150 training runs (5 presets × 2 algorithms × 5 A values × 3 seeds) at 5M steps each, with Optuna-optimized hyperparameters (200 HPO trials). Cross-evaluated with 2,500 gauntlet matchups × 50 episodes. Built with custom vectorized NumPy environment and PyTorch PPO/SAC.
Why does SAC dominate? The entropy temperature ablation tests the natural hypothesis that SAC’s entropy bonus is the key mechanism. The answer is nuanced: auto-tuned entropy decays to near-zero within 500K steps. What matters is a brief high-entropy bootstrapping phase — and fixed entropy is catastrophically worse than no entropy at all.
| Study series: Reward Shaping | HPO & Zoo Mixing (this page) | Entropy Ablation |