DEI Case Study: Nygaard 2022 Wake Model
This page documents design regret analysis using PyWake's Nygaard_2022 literature wake model defaults.
See also: Main DEI case study for analysis with Bastankhah and OMAE wake models.
The Cluster
The Danish Energy Island is a planned 9.9 GW offshore wind cluster in the North Sea with 10 wind farms arranged in a ring configuration.
 The DEI cluster: target farm (blue) surrounded by 9 neighbors.
| Component | Specification |
|---|---|
| Target farm | dk0w_tender_3, 66 turbines, 990 MW |
| Neighbors | 9 farms, 594 turbines total |
| Turbine rating | 15 MW |
| Rotor diameter | 240 m |
| Wind data | 10 years (2012-2021) |
Wake Model Configuration
The Nygaard_2022 model from PyWake's literature module:
| Parameter | Value |
|---|---|
| Model | TurboGaussianDeficit |
| A | 0.04 |
| ct2a | ct2a_mom1d |
| ctlim | 0.96 |
| superposition | SquaredSum |
| use_effective_ws | False (ambient) |
| use_effective_ti | False (ambient) |
| Ambient TI | 0.06 |
Key Finding: Three Neighbors Cause Regret
Using gradient-based optimization with 50 random starts and 2000 iterations per start, we tested each neighbor individually:
| Farm | Direction | Distance | Regret (GWh) | Regret (%) |
|---|---|---|---|---|
| 1 - dk1d_tender_9 | 214° (SW) | 38.9 km | 10.12 | 0.18% |
| 2 - dk0z_tender_5 | 262° (W) | 21.9 km | 8.76 | 0.16% |
| 3 - dk0v_tender_1 | 335° (NW) | 29.2 km | 0.00 | 0.00% |
| 4 - dk0Y_tender_4 | 349° (N) | 55.2 km | 0.00 | 0.00% |
| 5 - dk0x_tender_2 | 19° (NE) | 37.2 km | 0.00 | 0.00% |
| 6 - dk1a_tender_6 | 57° (E) | 43.7 km | 0.00 | 0.00% |
| 7 - dk1b_tender7 | 89° (SE) | 24.5 km | 0.00 | 0.00% |
| 8 - dk1c_tender_8 | 163° (S) | 29.3 km | 23.71 | 0.43% |
| 9 - dk1e_tender_10 | 186° (SSW) | 57.9 km | 0.00 | 0.00% |
| All 9 combined | (ring) | - | 14.77 | 0.27% |
Key observations: - 6 of 9 neighbors cause zero regret - Farm 8 (South, 163°) causes 23.71 GWh regret (0.43% of AEP) - highest - Farm 1 (SW, 214°) causes 10.12 GWh regret (0.18%) - Farm 2 (W, 262°) causes 8.76 GWh regret (0.16%) - All 9 together: 14.77 GWh—less than Farm 8 alone due to ring effect
Individual Neighbors Analysis
For each neighbor farm, we ran 50 multi-start optimizations under two strategies: - Liberal (blue circles): Optimize the target layout ignoring the neighbor - Conservative (red squares): Optimize the target layout considering the neighbor
Each layout is then evaluated under both scenarios (with and without the neighbor), producing a scatter plot of AEP with neighbor vs AEP without neighbor. Pareto-optimal points are shown with black outlines.
[Figure: Individual neighbors Pareto plots - TODO: generate dei_individual_neighbors_nygaard2022.png]
Observations: - Farms 3-7, 9: All optimization results collapse to a single Pareto point—no design tradeoff exists. - Farm 1 (SW, 214°): Shows 3 Pareto points with 10.12 GWh regret. - Farm 2 (W, 262°): Shows 2 Pareto points with 8.76 GWh regret. - Farm 8 (S, 163°): Clear Pareto frontier with 4 non-dominated points spanning 23.71 GWh of regret.
Farm 8 Detail
[Figure: Farm 8 Pareto - TODO: generate dei_pareto_farm8_nygaard2022.png]
| Layout | AEP Alone | AEP with Farm 8 | Loss |
|---|---|---|---|
| Liberal-optimal | 5575.3 GWh | 5454.1 GWh | -2.17% |
| Conservative-optimal | 5567.7 GWh | 5477.8 GWh | -1.61% |
| Regret | 7.6 GWh | 23.71 GWh | - |
The Pareto frontier contains 4 non-dominated layouts, showing a tradeoff between standalone performance and robustness to the southern neighbor.
All Neighbors Combined
When all 9 neighbors are present simultaneously (594 neighbor turbines):
[Figure: Combined Pareto - TODO: generate dei_pareto_combined_nygaard2022.png]
| Layout | AEP Alone | AEP with All Neighbors | Loss |
|---|---|---|---|
| Liberal-optimal | 5575 GWh | 5098 GWh | -8.6% |
| Conservative-optimal | 5556 GWh | 5113 GWh | -8.0% |
| Regret | 14.77 GWh |
The combined regret (14.77 GWh) is less than Farm 8 alone (23.71 GWh). This "ring effect" occurs because layouts optimized for all neighbors naturally spread turbines more evenly, which also reduces vulnerability to Farm 8.
Why Three Neighbors, Not Just Farm 8?
Unlike Bastankhah where only Farm 8 causes regret, Nygaard_2022 shows regret from three directions:
| Neighbor | Direction | Regret | Why? |
|---|---|---|---|
| Farm 8 (S) | 163° | 23.71 GWh | Directly downwind of dominant westerly |
| Farm 1 (SW) | 214° | 10.12 GWh | Partially downwind, close to dominant |
| Farm 2 (W) | 262° | 8.76 GWh | Aligned with dominant wind, closest (21.9 km) |
The wider wake expansion (A=0.04 vs 0.02) and SquaredSum superposition make the western neighbor's wakes more impactful at this distance.
Wind Rose
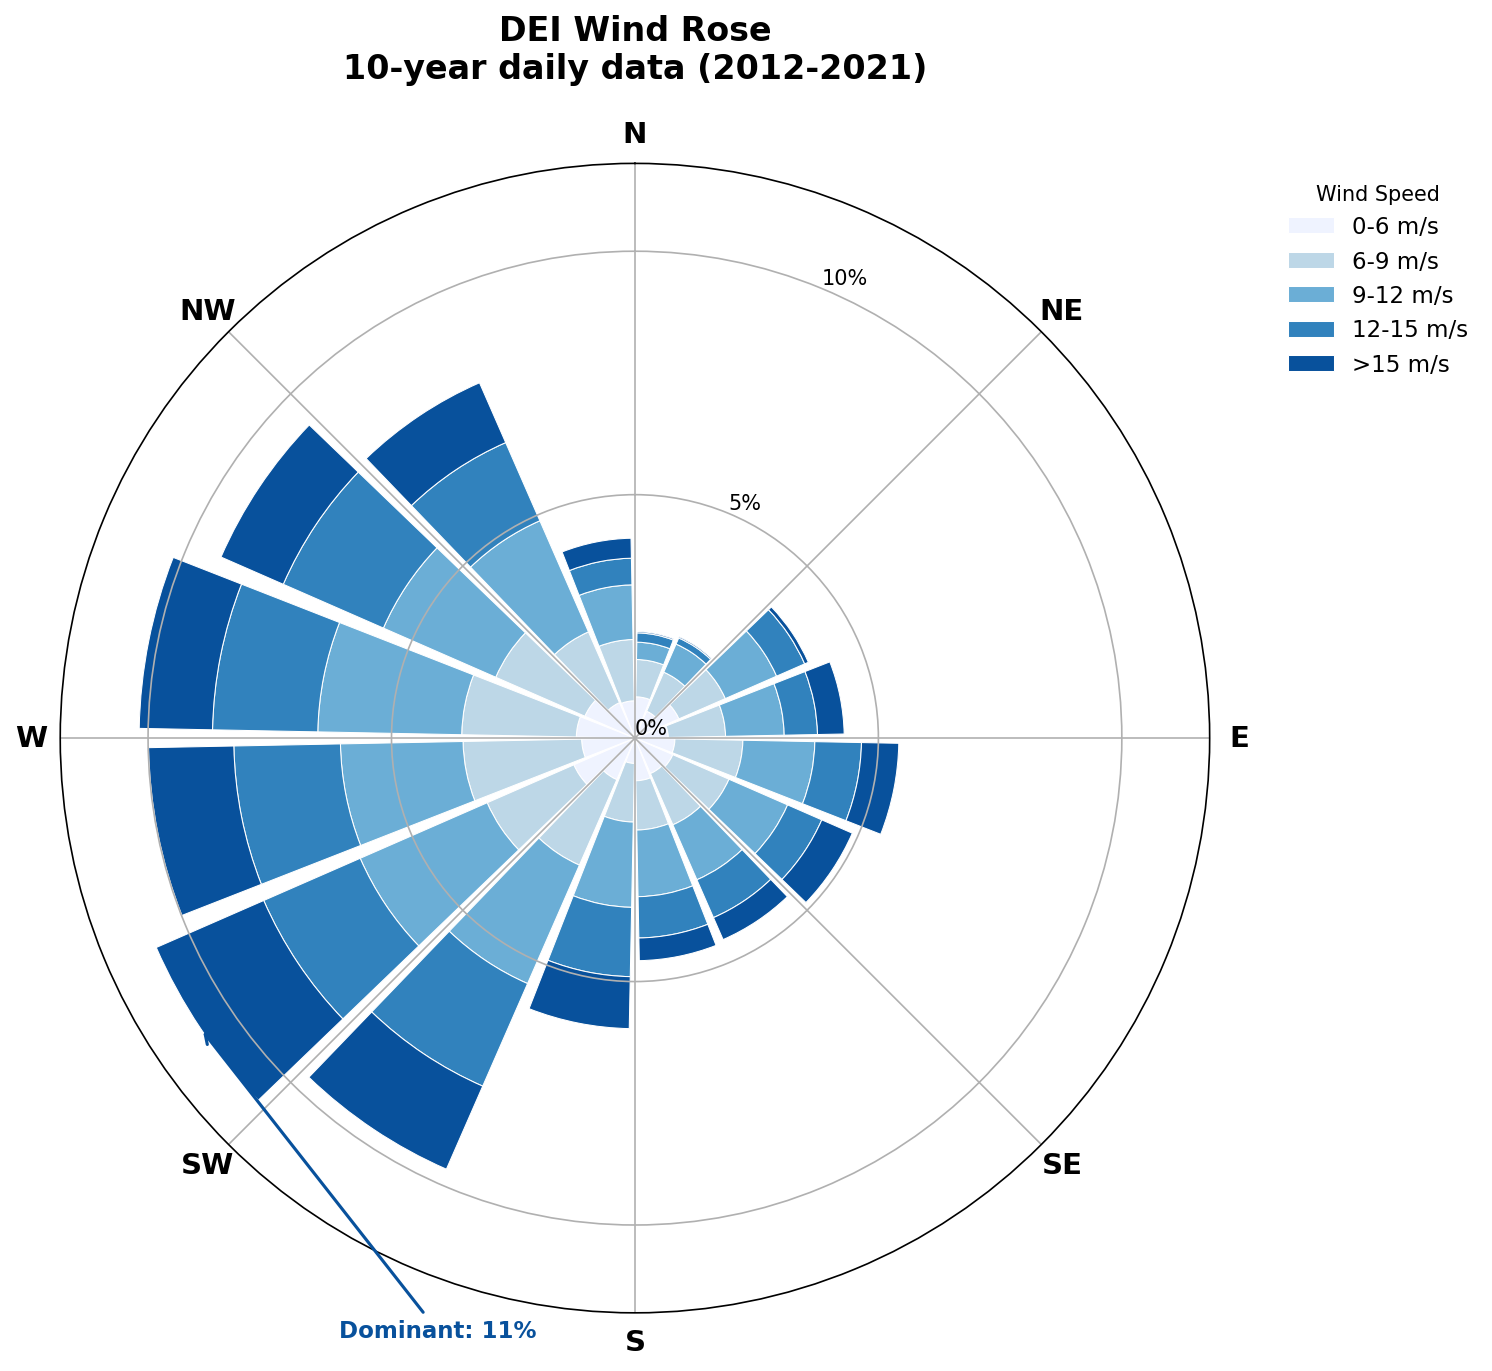
The Energy Island wind rose shows:
- Dominant: West-Southwest (225-270°)
- Secondary: South-Southeast (135-180°)
- Mean speed: 10.6 m/s
The 4% of wind from southern directions creates 23.71 GWh regret when the layout ignores it.
Comparison with Other Wake Models
| Metric | Nygaard_2022 | Bastankhah | OMAE TurboPark |
|---|---|---|---|
| A / k parameter | 0.04 | 0.04 | 0.02 |
| Superposition | SquaredSum | SquaredSum | LinearSum |
| Target AEP (alone) | 5575 GWh | 5829 GWh | 5436 GWh |
| Farm 8 regret | 23.71 GWh | 10.2 GWh | 36.3 GWh |
| Farm 8 regret % | 0.43% | 0.18% | 0.69% |
| Neighbors with regret | 3 | 1 | 1 |
| Combined regret | 14.77 GWh | ~10 GWh | ~14 GWh |
Key insight: Nygaard_2022 predicts intermediate regret magnitude but shows regret from more directions due to wider wake expansion.
Summary
| Finding | Value |
|---|---|
| Target farm AEP | 5575 GWh |
| Total cluster regret (Farm 8) | 23.71 GWh/year |
| Combined regret (all 9) | 14.77 GWh/year |
| Regret as % of AEP | 0.43% (Farm 8) |
| Primary regret source | Farm 8 (South, 163°) |
| Secondary sources | Farm 1 (SW), Farm 2 (W) |
| Dominant wind | 236° (WSW) |
| Key mechanism | Ambush effect + wider wakes |
Bottom line: With Nygaard_2022 defaults, three neighbors cause measurable regret instead of one. The ring geometry still reduces combined regret below the worst individual case.
Replication
pixi run python scripts/run_dei_single_neighbor.py \
    --wake-model=turbopark \
    --n-starts=50 --max-iter=2000 \
    --output-dir=analysis/dei_nygaard2022
Output files:
- analysis/dei_nygaard2022/dei_single_neighbor_turbopark.json - Full results
- analysis/dei_nygaard2022/layouts_farm[1-9].h5 - 100 optimized layouts per farm
- analysis/dei_nygaard2022/layouts_combined.h5 - Combined case layouts